
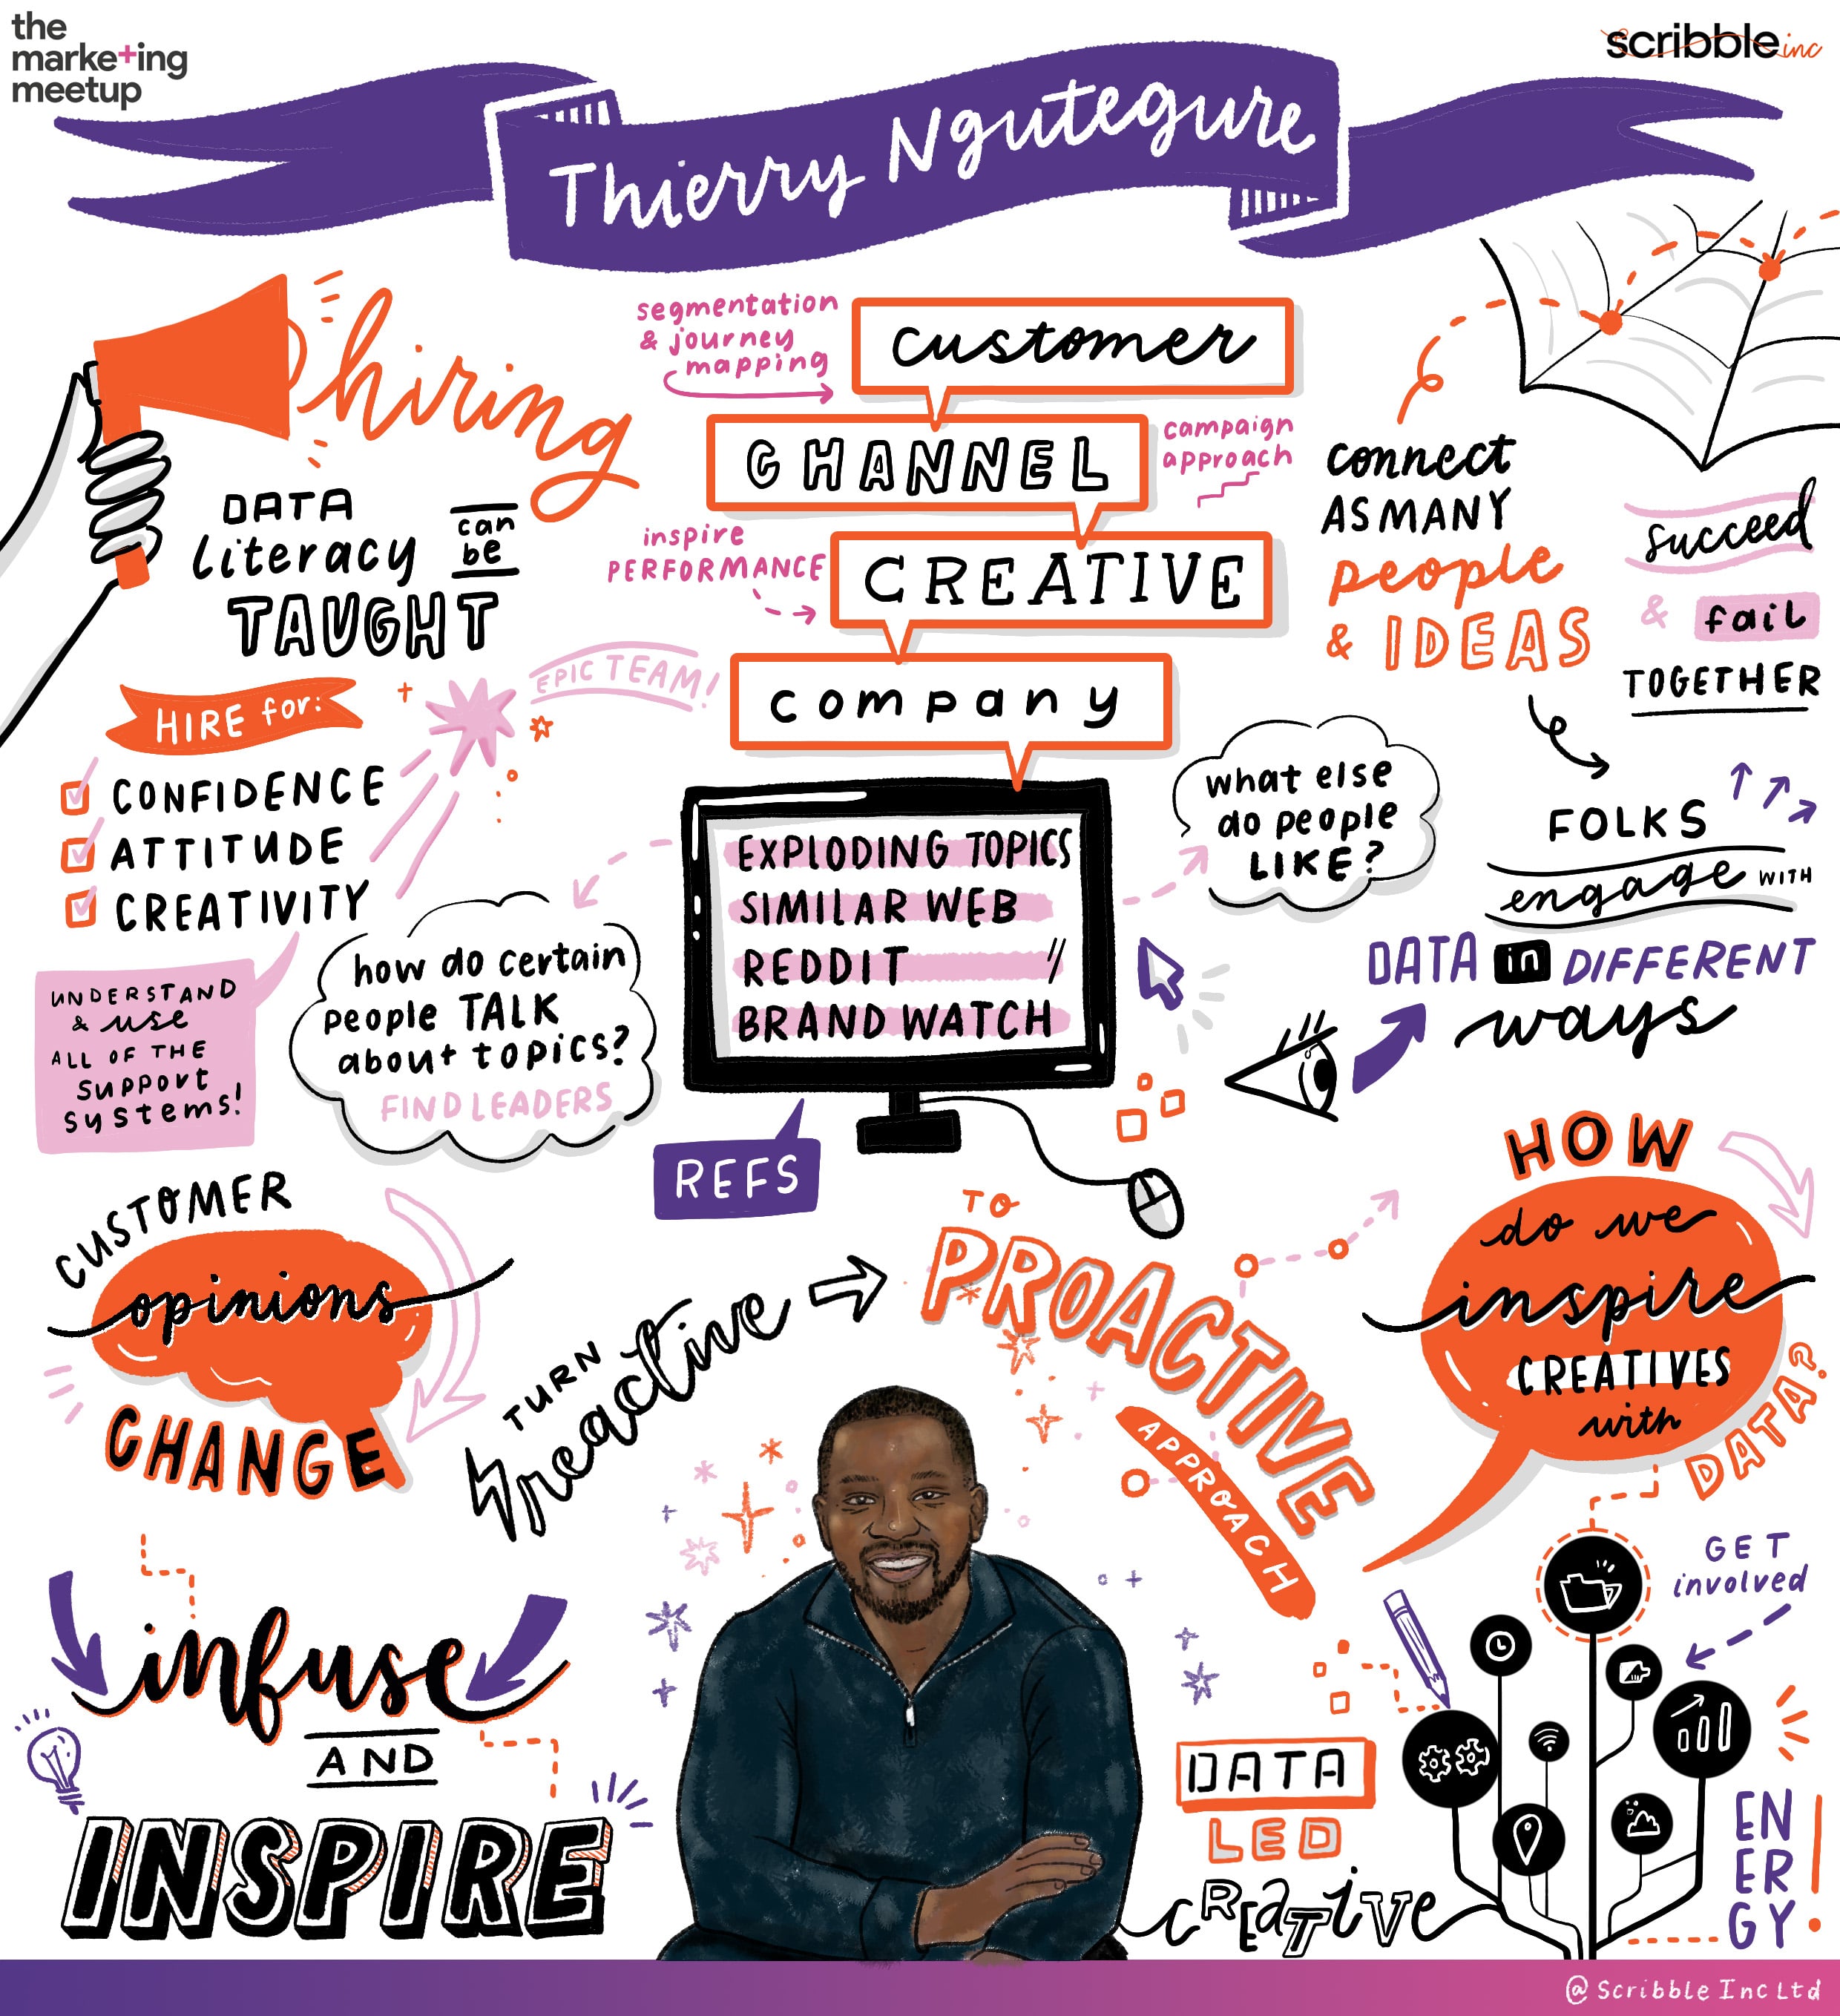
Key takeaways on the where’s, what’s and how’s of data
- Never analyze data in a vacuum. Establish context by going through the customer journey and keeping in mind their pain points and points of inspiration.
- Embrace the fact that different people want to see different things in different ways at different times. Don’t use a one-size-fits-all dashboard and instead cater to how those you work with prefer to derive their insights.
- It takes a team to score a goal. A good team turns into an epic team when people can get obsessed about someone else’s job, when they have the foresight to go to an expert to help them solve problems instead of trying to cobble everything together themselves.
Q and A on the where’s, what’s and how’s of data
[7:52] Q: How do you operate as a “data-driven creative”?
A: Even when you’re coming up with a creative concept, there’s no better way to understand the customer to be presented with that concept than through data. If you work in paid social, for example, how do you come up with your campaigns? How do you track them? How do you know when one asset is working and another isn’t?
[14:31] Q: What do you look for in data that you can turn into “insight” that someone can then act on?
A: We’re a generation that knows more than ever about our customers, yet we don’t understand them as well as we should. “Data” became a buzzword to signify some sort of prowess; but, whether you’re actually data-driven is a completely different story. Don’t just sit in the data and risk taking the numbers out of context. Go through the customer journey. What would the customer actually do? Understand their pain points as well as their points of inspiration. You don’t always have to come up with outcomes for the purposes of PR or creative. Sometimes it’s just about finding something that keeps our online brand healthy.
[22:33] Q: I’m struggling to get people to focus on the important data, rather than just pick some random stats and say, “Okay, we’re done for the day!”
A: It depends how you approach the data. There’s a quote that goes along the lines of, “Give me your opinion and I’ll find the stat to fit it.” There is a lot of retrospective analysis in which someone has a preconceived notion or bias about something and goes to the first numeric that justifies their position. From the top-down, show value right from the beginning. Put together a bit of audience insight. A great tool is YouGov which has a panel base of about 300,000 brits across 250,000 data points, and it can tell you everything from what brand of cat food people like to buy all the way to if they over-index on being vegan. The point is, help your team realize that looking for the right data helps the company distinguish itself.
[27:27] Q: Are there other data tools similar to YouGov that you can recommend?
A: AnswerThePublic is an absolutely brilliant one to understand what questions people are asking around a particular topic, the “who”, “what”, “when”, and “where”’s. Use Google Dataset Search if you have no idea what numerical value is out there for a given topic. For discovering peak trends and their respective search volumes, I’d use Exploding Topics. Semrush, as well. I’d use Buzzsumo to find out how many articles have been written about a particular topic, and how much engagement those articles have had. Reddit is an awesome way to understand how people talk about a certain topic. You can even start with Similarweb to reference similar websites to yours. My favorite social listing tools are Sprout Social, Meltwater, and Brandwatch.
[36:15] Q: What is the best source of data when you or your client does not have enough of their own just yet?
A: Test your assets such as your website and logo. Focus groups are also a great tool. If you’re watching costs, you don’t have to spend 20 grand immediately doing research. You can spread that out over the course of the year. Utilize always-on marketing.
[42:12] Q: What is your experience with dashboards?
A: The age-old problem is that different people want to see different things in different ways at different times. Don’t fight it. Some people are just comfortable with the way they see things. Understand people’s differences and cater to them. Some people only need a couple of minutes to look at a dashboard; others want to get into the nitty gritty. Google Data Studio, as a free starting point, is a phenomenal tool for visualizing KPIs and top-line metrics. You can put tabs in there for any kind of deeper analysis and even split by teams. You can even use a Google sheet that is already populated with data for the use of the more data literate. As a data individual, I hate being briefed in because that assumes that you know everything about my role in order for you to ask the right things. Whereas, if you see me as a source of inspiration to give my thoughts on how to proceed towards a certain goal.
[52:32] Q: What is your opinion on social listening?
A: I’m a big fan of social listening. My only issue is that it’s really hard to clean social listening data. This is because it ultimately picks up keywords within a certain group of text and limits them around certain factors. For example, if I wanted to learn who tweets about certain things by location, you can’t do it because not everybody sets their location. That’s already a limitation by itself. It doesn’t quite understand British humour as well as it should because it could read a cheeky message literally without taking the cultural nuances into account. Basically, don’t take what you collect from social listening as gospel. Social media has to be pulled into something else for validation, otherwise you run the risk of looking at one view one way and missing out on the full picture.